Using Python and PyMuPDF to extract text from tables in PDF - no annotations.
This isn’t the usual stuff that I write about. The only relation to the subject of SBP is that it’s about extracting data from SBP’s PDF pages. There is no commentary or analysis in this post. Please feel free to skip this post if you aren’t interested in this type of stuff.
In my last post, I wrote about SBP expanding its balance sheet.
I used the following chart from Business Recorder and manually extended it with the red dashed line to make the point.
The aforementioned is based on OMO injections. I wanted the data based on Monetary Policy Assets as appearing in the weekly Statement of Affairs ((SOA) of SBP. The trouble is, SBP doesn't provide the archived statements of affairs in a single Excel file. SOAs are published as individual PDFs on a weekly basis. It will be tedious to go through each PDF to get the data. There are 52 weeks in a year, so for two-year data, I will have to go through 104 PDFs. Not an impossible task, but very laborious and boring.
I googled extracting data from PDF using Python (I am a novice at Python) and PyMuPDF library came up as providing the best results. Most of the PyMuPDF code examples online were for annotated PDFs. SBP’s PDFs don’t have any annotations. I had to work out the code using the PyMUPDF documentation.
Here I am paying it forward by sharing my code if someone comes across similar challenges. [Needless to mention. I am not an expert in web scraping and python. There may have been much easier and quicker ways to perform this task]. Do let me know in comments or on Twitter if this was an entirely wasteful exercise.
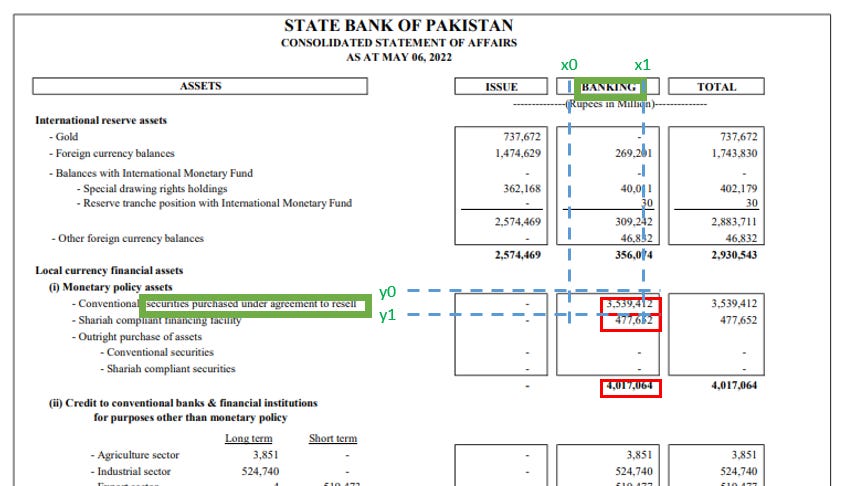
I have created red rectangles to show the data I need from SBP’s SOAs. I don’t need the Total data (the third red box) and extracting it posed extra challenges, but I did it as it will serve as a checksum i.e., to confirm that the data I extracted in the first two rectangles is correct.
From the PyMuPDF documentation
If you see a table in a document, you are not normally looking at something like an embedded Excel or other identifiable object. It usually is just text, formatted to appear as appropriate.
Extracting a tabular data from such a page area therefore means that you must find a way to (1) graphically indicate table and column borders, and (2) then extract text based on this information.
The PyMuPDF library allows extracting the data in multiple formats, including the following:
The “blocks” would have been easiest to work with. After trying it on a few SOAs, I realized that the SBP staff kept changing how they prepared the underlying Excel. Thus, “blocks” didn’t work. I had to go with “words”.
words = page1.get_text("words") ## generates a list of words on the page 1 of PDFIt generates a list of words, with each word represented by the list of 8 elements. The first four elements are the rectangular coordinates of that specific word, the 5th one being the word, and the 6th, 7th, and 8th being block number, line number, and word number as shown below.
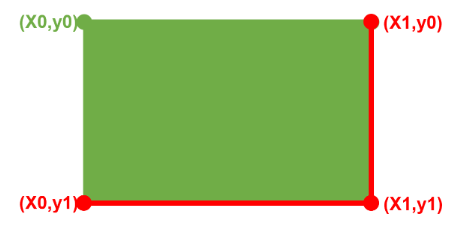
(x0, y0, x1, y1, "word", block_no, line_no, word_no)(x0,y0) and (x1,y1) are the top left and bottom right corner of the rectangle, e.g., the red rectangle was added in the SOA.
For example, see below the output of the word “BANKING” which is the column heading on the SBP PDF.
(392.2300109863281, 92.48432159423828, 424.43890380859375, 101.79151916503906, 'BANKING', 0, 1, 0)
I can search for a specific text using the “search_for” method. The output is rectangular coordinates. When I run a search for the number in the first red rectangle, the output gives me two sets of four coordinates.
If you look at the SBP PDF image I shared earlier, the number 3,539,412 appears twice, once in the BANKING column and again in the TOTAL column. That’s why two sets of coordinates were provided. I need the number appearing in the BANKING column, which is the first four coordinates.
If the output had been from an MIS, I could use the above coordinates across all the PDFs. Unfortunately for me, SBP officials kept playing around with their Excel sheet’s formatting, with the result that different Excel sheets have different locations for this data.
Thus, I have to come up with a different logic to get that data.
After some playing around, I realized that if I used the x-coordinates of the “BANKING” and y-coordinates of “securities purchased under agreement to resell”, I will get the requisite data.
banking_head = page1.search_for("BANKING") # for x-coordinatesconv_head= page1.search_for("securities purchased under agreement to resell") # for y-coordinatesWell, almost. As you can see that BANKING is center-aligned in the column while the data I seek is right-aligned. So I will have to add some cushion to the left and right of the x0 and x1 coordinates of BANKING so that I cover the entire column. As different pages have different formats, I dare not modify the coordinates, say by adding or subtracting an arbitrary number. Rather, I calculate the distance between x0 and x1 as a banking_delta and add half of it to either side of x0 and x1 as a cushion or padding. As a result, it doesn’t matter what is pixel density of the page. The data will always be within the coordinates, as it will cover the entire column. For the y-coordinates, I don’t make any changes.
banking_delta = (banking_head[0][2]-banking_head[0][0])/2 x0,x1 = banking_head[0][0]-banking_delta,banking_head[0][2]+banking_delta
y0,y1 = conv_head[0][1],conv_head[0][3]I create rectangle coordinates for the conventional securities by passing on the coordinates that I calculated above.
conv_coord = fitz.Rect(x0,y0,x1,y1)Subsequently, I use list comprehension to return the word (w[4]) which is the fifth element (the counter in Excel starts from [0]) for the word whose coordinates (first four elements) are within the coordinates we created.
[w[4] for w in words if fitz.Rect(w[:4])in conv_coord]The data returned is in string format. I transform it into integer format. And voilà, I have the information that I need.
It took the program less than a minute to compile all the data after going through 96 PDFs (though it took me a week to work out these 30-40 lines of code). In two of the PDFs, SBP saved the page as an image. For now, I just manually inputted the data for those two sheets. In the future, I will build an OCR functionality to capture those as well. This is how the data looks when exported to Excel and formatting it a bit.
And the updated graph, for which I did the whole exercise
Additional Info
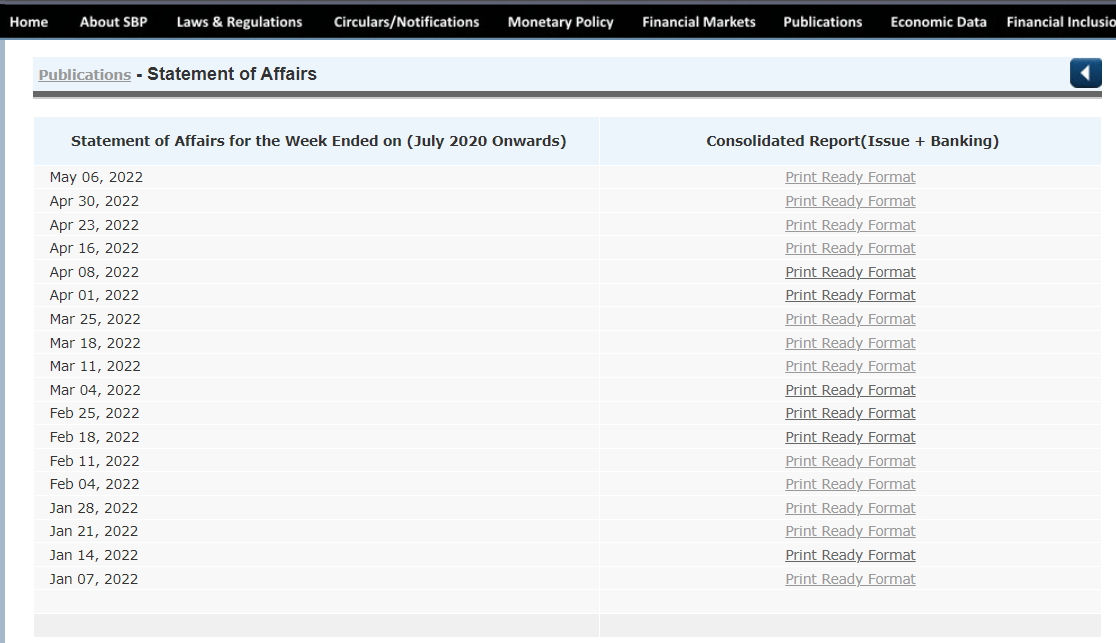
This is the index of SBP’s statement of affairs.
This is how the files are displayed if you click any year on the above page. The format was different before July 2020, but we will limit ourselves to July 2020 for this exercise.
The file naming convention is “dd-mmm-yy.pdf”. The URL for the May 6 SOA, for example, is
https://www.sbp.org.pk/publications/statements/2022/06-May-2022.pdf
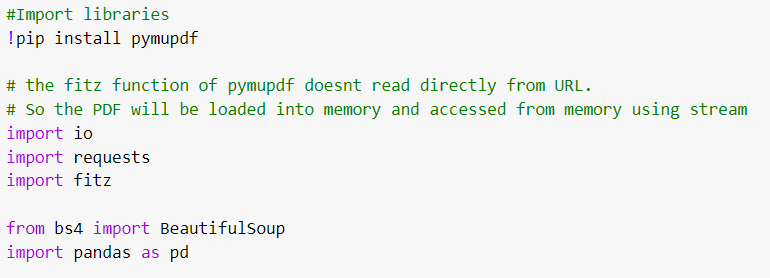
Loading the libraries
I start by loading all the libraries, including BeautifulSoup. You can’t scrape a website without BeautifulSoup :) .
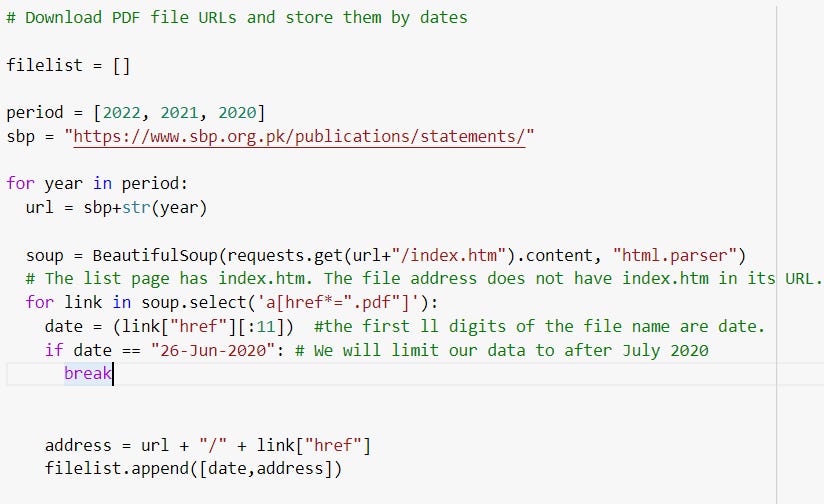
Downloading the list of file URLs
Then I download the URL of the files that I will extract data from and store them by date in a list called filelist. The date is extracted from the name of the file.
Creating helper functions to extract data and transform it
Bringing it all together
Downloading the PDF files into memory from the URLs stored in filelist, using helper functions to extract data, and adding the data to the last three columns in filelist. I also show the first few rows of the output by printing it at the bottom.
I need better hobbies.
The entire code
######################################################
#Import libraries
!pip install pymupdf
# the fitz function of pymupdf doesnt read directly from URL.
# So the PDF will be loaded into memory and accessed from memory using stream
import io
import requests
import fitz
from bs4 import BeautifulSoup
import pandas as pd
######################################################
### Download PDF file URLs and store them by dates ###
filelist = []
period = [2022, 2021, 2020]
sbp = "https://www.sbp.org.pk/publications/statements/"
for year in period:
url = sbp+str(year)
soup = BeautifulSoup(requests.get(url+"/index.htm").content, "html.parser")
# The list page has index.htm. The file address does not have index.htm in its URL.
for link in soup.select('a[href*=".pdf"]'):
date = (link["href"][:11]) #the first ll digits of the file name are date.
if date == "26-Jun-2020": # We will limit our data to after July 2020
break
address = url + "/" + link["href"]
filelist.append([date,address])
######################################################
### HELPER FUNCTIONS ###
###Tranform string into integers###
def transform_data(data): # to transform the data from string to digital
if data == [] or data == ["-"]: # Sharia data is mostly nil or has "-" in it.
return 0
else:
return int(data[0].replace(",",""))
###getting the raw data, extracting coordinates and using coordinates to extract needed data###
def get_data(words,conv_head,banking_head,sharia_head,total_head):
## Calculating coordinates (no prefix for conventional, s prefix for sharia, t prefix for total) ##
banking_delta = (banking_head[0][2]-banking_head[0][0])/2
  x0,x1 =  banking_head[0][0]-banking_delta,banking_head[0][2]+banking_delta
 y0,y1 = conv_head[0][1],conv_head[0][3]
s_y0,s_y1 = sharia_head[0][1],sharia_head[0][3]
y_delta = sharia_head[0][1] - conv_head[0][1]
t_y0,t_y1 = total_head[0][1]+y_delta, total_head[0][3]+y_delta
## Creating rectangular coordinates ##
conv_coord = fitz.Rect(x0,y0,x1,y1)
sharia_coord = fitz.Rect(x0,s_y0,x1,s_y1)
total_coord = fitz.Rect(x0,t_y0-2,x1,t_y1+2)
## Using list comprehension to extract data ##
conv = transform_data([w[4] for w in words if fitz.Rect(w[:4])in conv_coord])
sharia = transform_data([w[4] for w in words if fitz.Rect(w[:4])in sharia_coord])
total = transform_data([w[4] for w in words if fitz.Rect(w[:4])in total_coord])
return conv, sharia, total
#####################################################
### Bringing it all together ###
## Creating a filelist with list of URLs of PDF files ##
for counter in range(len(filelist)):
url = filelist[counter][1]
request = requests.get(url)
filestream = io.BytesIO(request.content)
pdf = fitz.open(stream=filestream, filetype="pdf")
page1 = pdf[0] #focus on the first page of PDF
words = page1.get_text("words") ## generates a list of words on the page
if words == "" or words == []: #if the file is stored as image i.e. no words, move on to next PDF
continue
## get the y-coordinates and the x-coordinates
conv_head= page1.search_for("securities purchased under agreement to resell") # for y-coordinates
sharia_head = page1.search_for("Shariah compliant financing facility") # for y-coordinates
banking_head = page1.search_for("BANKING") # for x-coordinates
total_head = page1.search_for(" Shariah compliant securities") #for y-coordinates
## pass list of words in documents and coordinates to helper functions ##
conv,sharia,total = get_data(words,conv_head,banking_head,sharia_head, total_head)
## append the data to filelist ##
filelist[counter].extend([conv,sharia,total])







This is a super, if one can do this, I have tried to learn python from online sources, they explain basic stuff like strings,dicts,tuples,data types,etc.., but they don't teach you how to do the stuff you want to do, Can you please guide me, which courses you took to develop your understanding of python to be able do this.
This was such an informative article! I have used PyMuPDF in the past along with several other Python packages to extract whatever I needed (I too am a novice Python user, I do data science and its just a tool for me but I do need to get better at it). I didn't really dive too deep in the docs on this package but this article has really changed my perspective of the power of this package. I now have new insights on how to get after some data in some PDFs that I didn't know before! Thank you so very much for this article. Now I too will have to find a way to pay it forward!